87334 content assets delivered to 1,000+ happy brands & agencies
Beauty & cosmetics
Apps & software
Beauty & cosmetics
Apps & finance
Beauty & cosmetics
Apps & software
Food & beverage
Food & beverage
Consumer services
Food & beverage
Food & beverage
Consumer
Apps & software
Health & wellness
Health & wellness
Pets
Health & wellness
Beauty & cosmetics
How to Track ROI from UGC Campaigns
Working with content creators is one of the best ways to bring fresh, authentic energy to your marketing.
But at the end of the day, every campaign has to justify its value - and that’s where ROI tracking comes in. There are plenty of practical ways to gauge how UGC campaigns are impacting your business. Let’s break it down into approachable steps.
Start by Defining Your Goals
Before starting any campaign, it’s important to know what you’re measuring. Are you focused on increasing sales? Driving more traffic to your website? Building your brand’s social media following? Having clear objectives will guide how you measure the return on your investment.
Common Goals for UGC Campaigns:
Increase conversions: Are the short form UGC videos from micro creators driving purchases?
Improve engagement: Are your campaigns encouraging likes, comments, and shares?
Enhance brand awareness: Are more people recognising and talking about your brand?
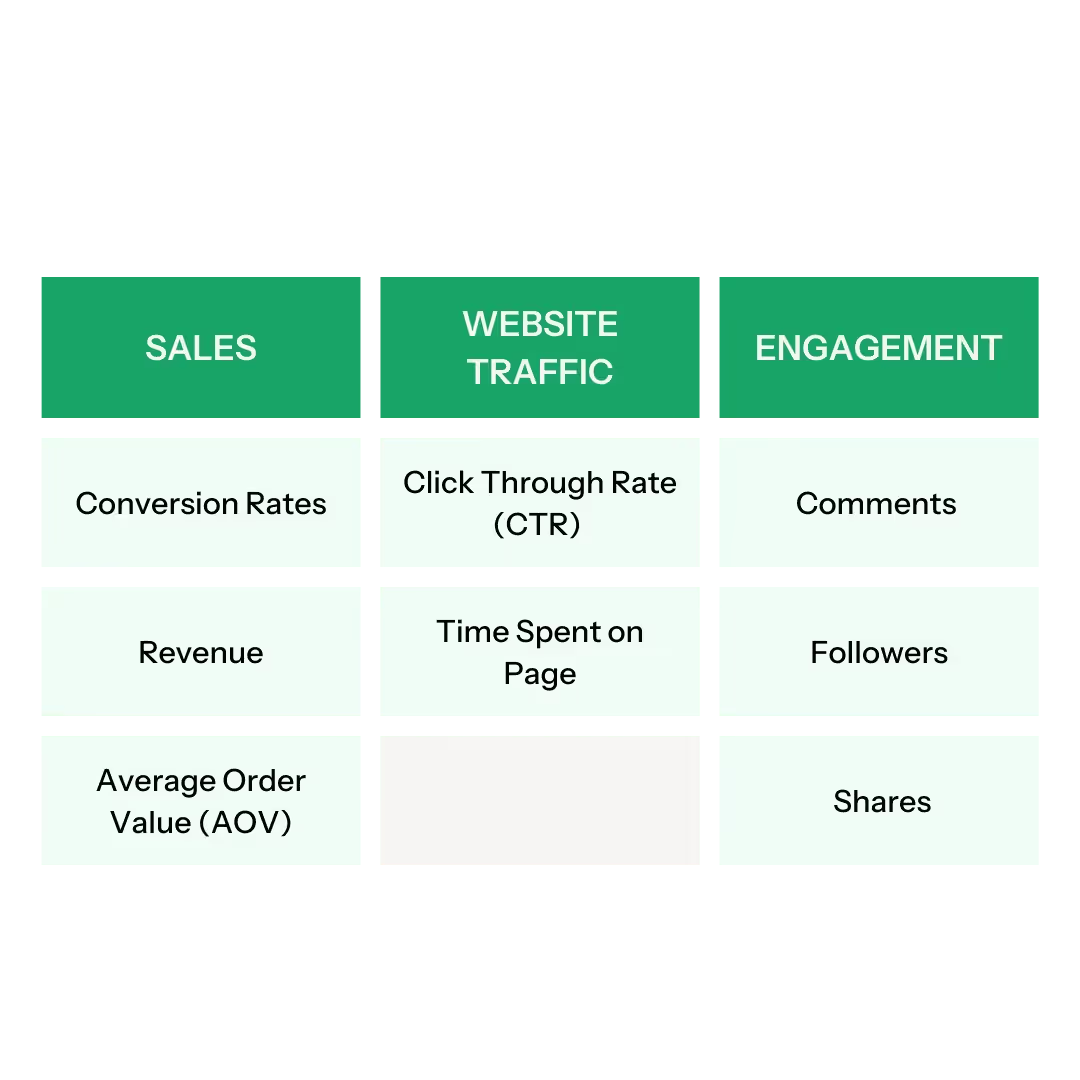
Set KPIs That Match Your Goals
Key Performance Indicators (KPIs) give you concrete data points to track progress. Pair each goal with specific metrics to see how well your UGC campaigns are delivering results. Here are some examples:
For Sales:
Conversion rates
Revenue generated from UGC-driven campaigns
Average order value (AOV) from UGC users
For Website Traffic:
Click-through rates (CTR) from UGC links
Time spent on pages featuring UGC content
For Engagement:
Comments and shares on Short Form UGC Videos
Growth in followers after running UGC campaigns
Measure Success in Paid Ads Featuring UGC
UGC is a go-to for paid ad content because it feels authentic and relatable. To track ROI from Micro Creators for Paid Ads, use ad platform analytics to monitor metrics like:
Cost per acquisition (CPA): How much are you spending to get a new customer?
Click-through rates: Are people clicking on your UGC ads more than other types of content?
Return on ad spend (ROAS): What’s the revenue return compared to your ad budget?
These numbers can tell you if your micro creators are giving you affordable UGC content that drives performance.
Track Engagement and Reach on Social Media
Not all ROI is tied to sales. Sometimes the value of UGC is in how it connects with your audience and spreads awareness. Platforms like Instagram, TikTok, and Pinterest offer analytics to track:
Impressions: How many times your UGC content has been seen
Reach: How many unique users interacted with your UGC posts
Engagement rates: The percentage of users who liked, commented, or shared your UGC posts
If a short form UGC video goes viral, that can pay dividends in organic reach and brand exposure.
Pay Attention to Customer Feedback
Sometimes the ROI is about sentiment. Are people commenting on how much they love seeing real creators using your product? Are they tagging their friends and joining in on the conversation?
UGC can help humanise your brand and build trust, even if it’s not always directly tied to revenue.
Use Post Purchase Surveys to Gather Insights
Ask your customers where they heard about your product. Post-purchase surveys can include questions like:
Did a social media post influence your decision to buy?
Did you watch any creator videos before purchasing?
Which creators inspired you to try the product?
These insights can help you refine your future UGC campaigns.
Combine Data from Multiple Campaigns
UGC is an affordable way to create fresh content, but the real value often comes from experimenting with different approaches.
Compare the performance of campaigns that use short form UGC videos versus campaigns using other types of content. Are micro creators generating more clicks and sales? Are shoppable videos making checkout easier?
Aggregating data over time will give you a clearer picture of what’s working and where to invest next.
The Bigger Picture
Follow us along
Get fresh UGC insights to your inbox
Oops! Something went wrong while submitting the form.
The Fundamentals of UGC
More resources
50%+ increase in Meta social ad conversions
Putting a Friendly Face to Money Pilot with UGC
Money Pilot wanted content that felt more relatable than static social posts alone. Through Twirl, the team connected with creators who helped bring the brand to life, creating content that resonated with audiences and delivered strong results.
Streamlining Creator Collaborations for Phlo Clinic
Phlo Clinic wanted a faster and more efficient way to manage creator campaigns and produce content that felt right for the brand. Using Twirl, the team streamlined creator sourcing and simplified collaboration across the entire content production process.
GRIND wanted a more authentic way to showcase its Summer Pods launch through paid social creative. Using Twirl, the team streamlined creator sourcing and produced UGC video ads that delivered higher CTR and lower CPA compared to BAU creative.
Discover what our users have to say about their experience with us.
"Twirl was a dream to work with. I had used one of their competitors previously, but the creators on Twirl were absolutely a cut above those on [other platform]. It was worth every penny and our agency will be a consummate Twirl customer from now on."
Annabel, Account Manager @ 303 London
Agency
1
/
3
"Twirl was a dream to work with. I had used one of their competitors previously, but the creators on Twirl were absolutely a cut above those on [other platform]. It was worth every penny and our agency will be a consummate Twirl customer from now on."
Annabel, Account Manager @ 303 London
Agency
"Twirl has helped us really scale up our production of native-looking content. We run a lot of creative testing & these styles of ad often come out as top performers."
Richard, Senior Growth Manager @ Thriva
Agency
Twirl has made UGC creation a breeze, eliminating time-consuming admin and allowing us to focus on more strategic business tasks. The diverse creator pool and streamlined communication have been game-changers for our campaigns."
Sarah, Growth Marketing @ Treatwell
Agency
The better way to get great UGC done
Twirl is your go-to partner for UGC. Whether you're a brand, agency or a UGC creator, we bring together 7000+ talented creators to produce authentic, scroll-stopping content for ads, websites, emails, and social channels.


.avif)


.avif)


.avif)


.avif)


.avif)
.avif)


.avif)
.avif)


%20(1).png)
%20(1).png)
%20(1).png)
%20(1).png)
.png)
%20(1).png)
.avif)
.avif)

!["Twirl was a dream to work with. I had used one of their competitors previously, but the creators on Twirl were absolutely a cut above those on [other platform]. It was worth every penny and our agency will be a consummate Twirl customer from now on."](https://cdn.prod.website-files.com/64db5aa75d4b6be398d7a340/6822180e5beca4ac00741be5_6703df23a4ef54cfd6db0d56_Frame%209.avif)


.svg)
.svg)